The Bureau of Labor Statistics’ (BLS’) Prescription Drug Consumer Price Index (CPI‐Rx) looks at price changes for drugs dispensed at outpatient retail pharmacies. However, many pharmaceuticals–especially infusions and injections–are administered at physician offices or hospitals. How would including physician-administered drugs impact the CPI-Rx?
That is the question a paper by Hicks, Berndt and Frank (2024) aims to answer. The authors argue that including the largely physician-administered specialty drugs is important because specialty drugs comprised 55% of U.S. drug spending in 2021, which was nearly double the 28% share from a decade earlier. Over half (52%) of specialty drug spending was on oncology; the next largest category was inflammatory diseases (e.g., rheumatoid arthritis) at 9%.
An important note on calculating CPI is that the medical costs include all allowed charges (i.e., out-of-pocket payments by patients and also reimbursement from public and private payers).
To examine the potential impact of including physician-administered and specialty drugs into the CPI-Rx, the author use 2010-2019 data from the Merative MarketScan Commercial Database. The authors compare versions of CPI that captures 100% of specialty drugs in MarketScan against alternative CPIs
measures capturing only 5%, 25%, 33%, and 50% of specialty drugs. CPI is calculated using a chained Laspeyres index.
Using this approach, the authors find that:
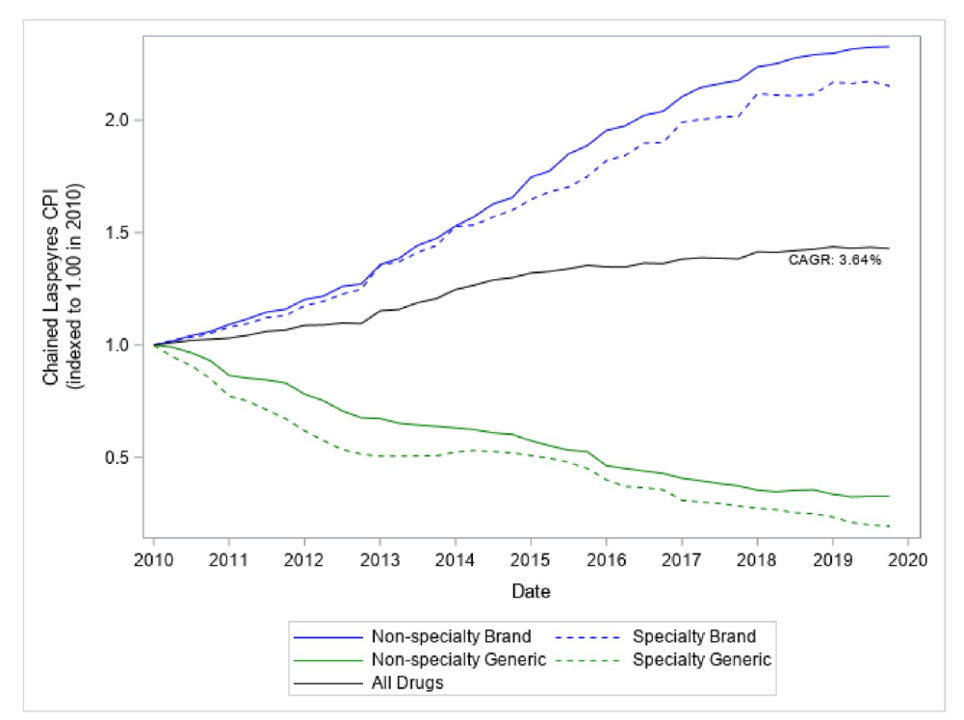
The non‐seasonally adjusted published BLS CPI‐Rx has a cumulative annual average growth rate (CAGR) of 2.99% for the January 2010 ‐ December 2019 time period.30 Our fully representative CPI‐Rx which includes all specialty and nonspecialty retail and mail‐order pharmaceutical claims from MarketScan data has a CAGR of 3.64%. The more fully representative sample therefore has a CAGR 22% higher than the BLS CPI‐Rx (0.65% points higher).
Paradoxically, while the inclusion of specialty drugs into CPI raises CPI-Rx, drug prices for non-specialty drugs actually increased faster than for specialty.

The authors explain this phenomenon as follows.
Surprisingly, non‐specialty brand and non‐specialty generic prices rise faster than the corresponding specialty prices. This may be due to high launch prices of specialty drugs (which are not captured in a chained Laspeyres index) Because new products are a considerably larger share of specialty products compared to all branded drugs, the share of generic drugs in the specialty category will be much smaller than in the non‐specialty drug grouping. Thus, when the aggregate price index is calculated the weight given to generic drugs is lowered by enlarging the specialty sample. This is what causes the aggregate index to rise as the specialty sample grows even though branded specialty prices are growing more slowly than are other brands.
Note that the price index looks at gross prices and does not take into account drug rebates. However, a 2019 CBO report notes that rebates for specialty drugs in Medicare Part D are smaller than those for branded prescription drugs overall.
You can read the full paper here.


