Kahneman and Tversky’s Prospect Theory posit that individuals have loss aversion. What is loss aversion?
It means that individuals experience losses more intensely than gains of the same magnitude; for instance, the psychological impact of losing a certain amount of money is greater than the pleasure derived from gaining that same amount. A key question is how much more intensely to individuals experience gains than losses?
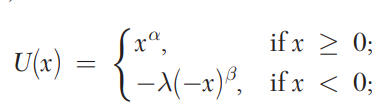
To formalize things, prospect theory assumes the following utility function:
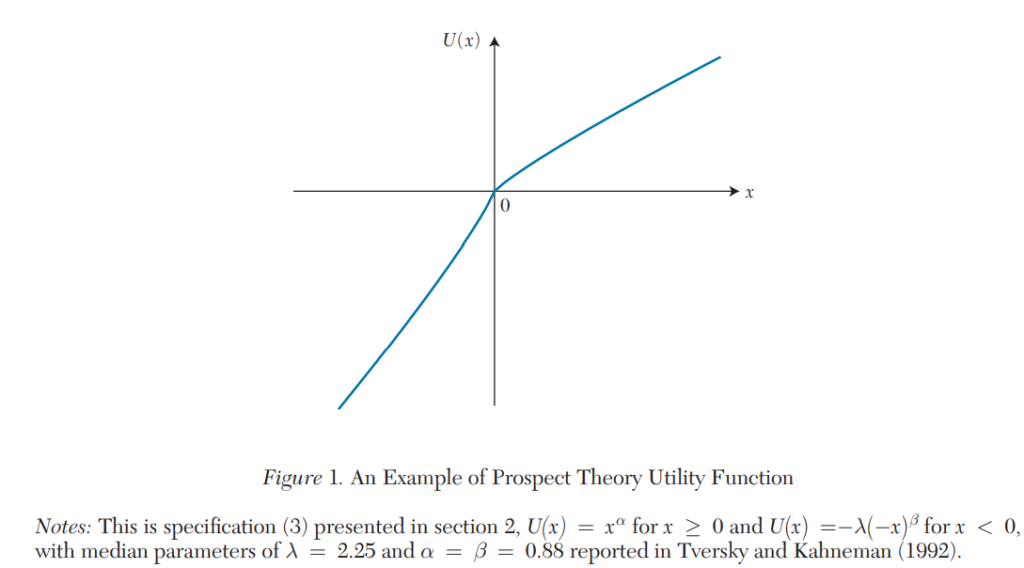
The most widely cited estimates are for these parameters are from Tversky and Kahneman (1992). In that paper they find that loss aversion λ=2.25, and α=β=0.88. We can plot the utility function with this parameterization on the graph below as follows.
One key issue, however, is that the Tversky and Kahneman (1992) loss aversion estimates came from a single study of 25 graduate students from an elite American university. How generalizable are these results? Is there a better estimate of loss aversion out there?
A paper Brown et al. (2024) aims to answer this question by conducting a meta-analysis of loss aversion estimates from all studies published between 1992 and 2017. They found 607 empirical estimates of loss aversion across 150 articles. The studies came from a variety of disciplines (e.g., economics, psychology, neuroscience) and a variety of data types. Most studies (53%) relied on a lab experiment design, but 26.5% of articles identified came from a field experiment of other field data; 42% of the studies came from Europe and 30% came from North America.
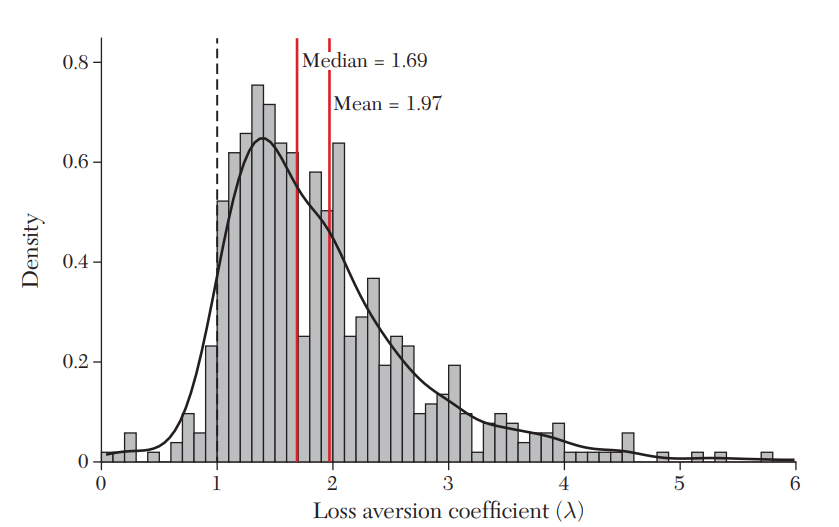
The unadjusted results (shown below) estimated a median loss aversion of 1.69 and mean loss aversion of 1.97. After applying a random effects meta-analytic distribution, the mean loss aversion coefficient was found to be 1.955 with a 95% probability that the true value falls between 1.820 and 2.102.
These results are somewhat lower, but not disimilar to the Tversky and Kahneman (1992) estimate of 2.25. We can also compare the results to two previous meta-analysis studies of loss aversion. Neumann and Böckenholt 2014–which examined los aversion using 33 studies about consumer brand choice–reported a base model estimate of λ = 1.49 and an “enhanced model” estimate of λ = 1.73; Walasek, Mullett, and Stewart (2018)–which examined 17 studies of gain-loss financial lotteries–estimated that λ = 1.31. In short, the Brown et al. results are higher than previous estimates, but lower than Tversky and Kahneman.
You can read the full paper here.
Key References
- Brown, Alexander L., Taisuke Imai, Ferdinand M. Vieider, and Colin F. Camerer. “Meta-analysis of empirical estimates of loss aversion.” Journal of Economic Literature 62, no. 2 (2024): 485-516.
- Neumann, Nico, and Ulf Böckenholt. 2014. “A Meta-Analysis of Loss Aversion in Product Choice.” Journal of Retailing 90 (2): 182–97.
- Tversky, Amos, and Daniel Kahneman. 1992. “Advances in Prospect Theory: Cumulative Representation of Uncertainty.” Journal of Risk and Uncertainty 5 (4): 297–323.
- Walasek, Lukasz, Timothy L. Mullett, and Neil Stewart. 2018. “A Meta-Analysis of Loss Aversion in Risky Contexts.” http://dx.doi.org/10.2139/ssrn.3189088.